
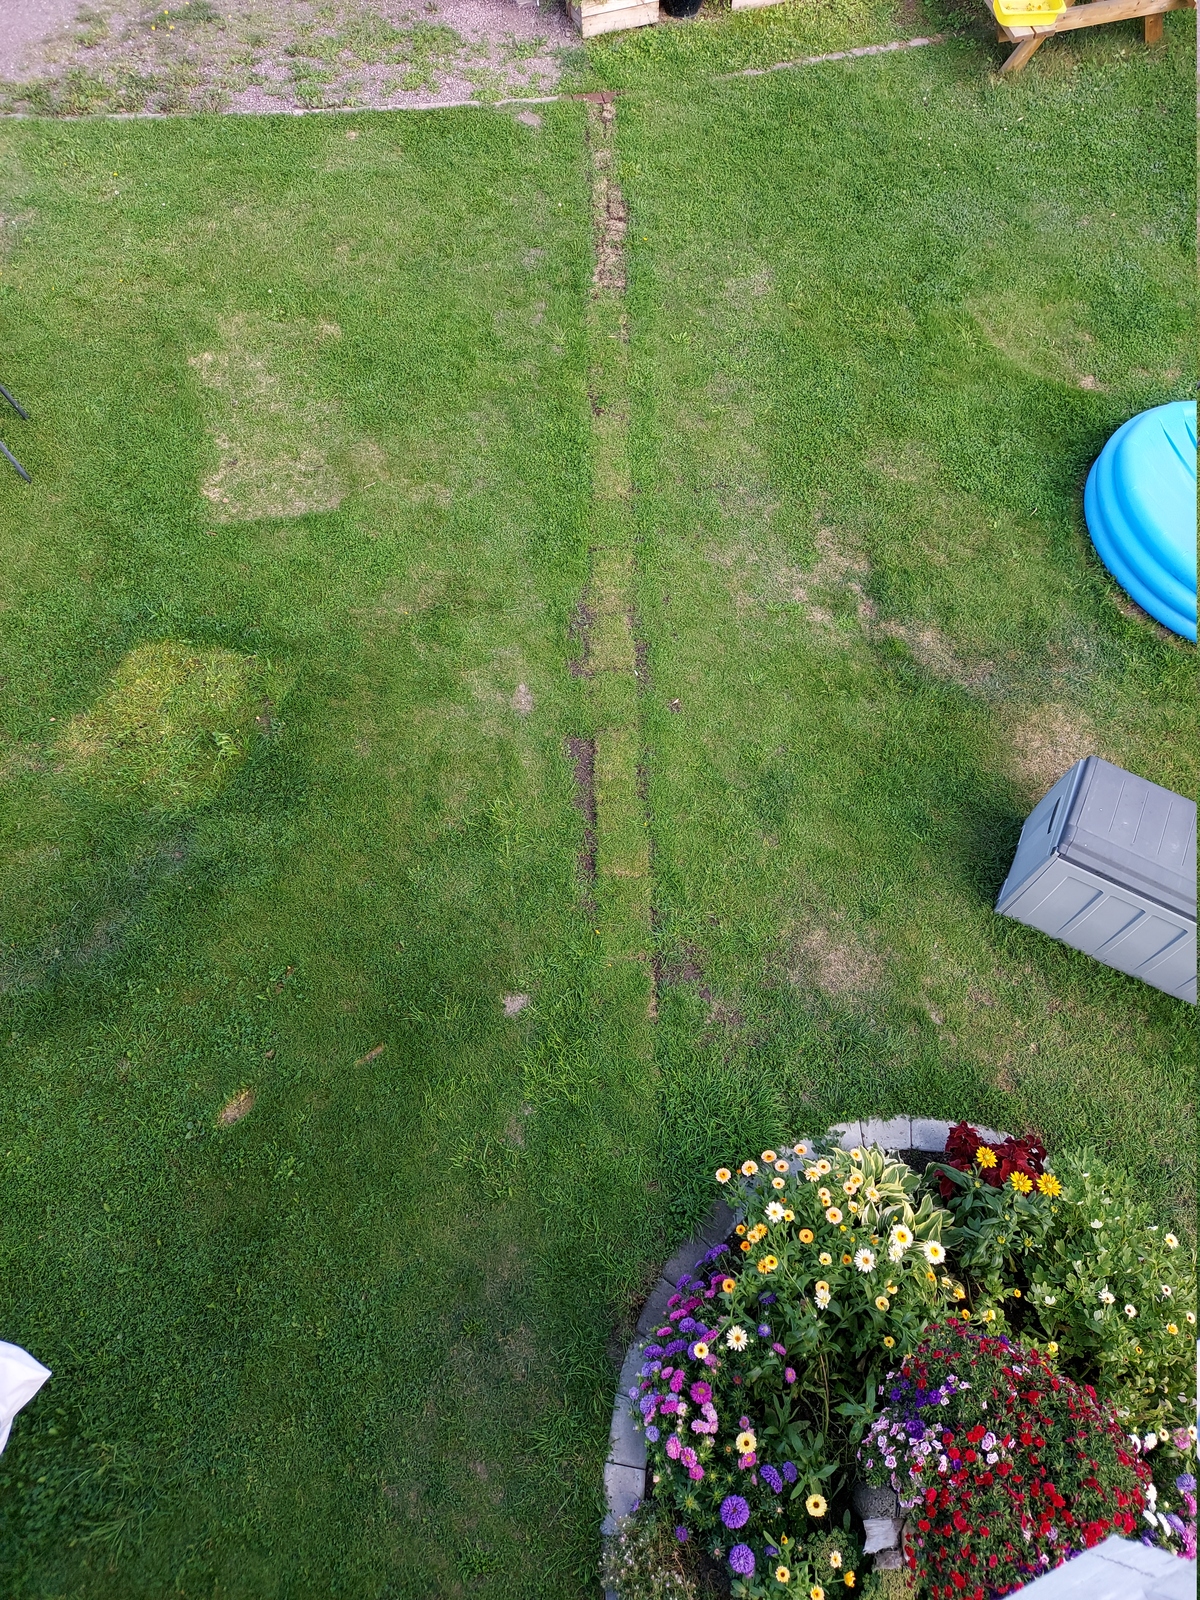
On Tuesday August 24th I posted a link to my Running underground CAT6 to detached garage post on the r/homelab subreddit. The Reddit post got lots of upvotes and comments — and started climbing on the r/homelab front page.
This generated a spike of traffic like I have never gotten before. In this post I’m going through some numbers; like performance, traffic and cost.
Table of contents
The traffic spike
I posted the link to Reddit at 09:25 AM central European summer time, and it immediately started picking up traffic. With another huge spike in the afternoon.
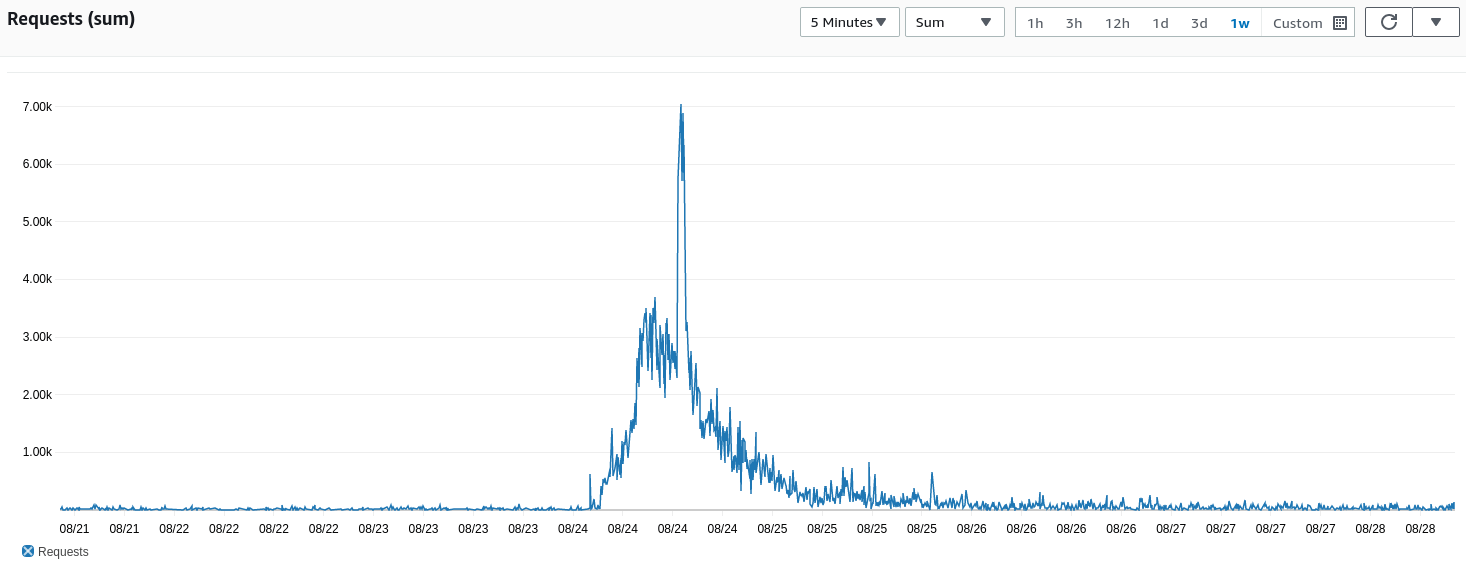
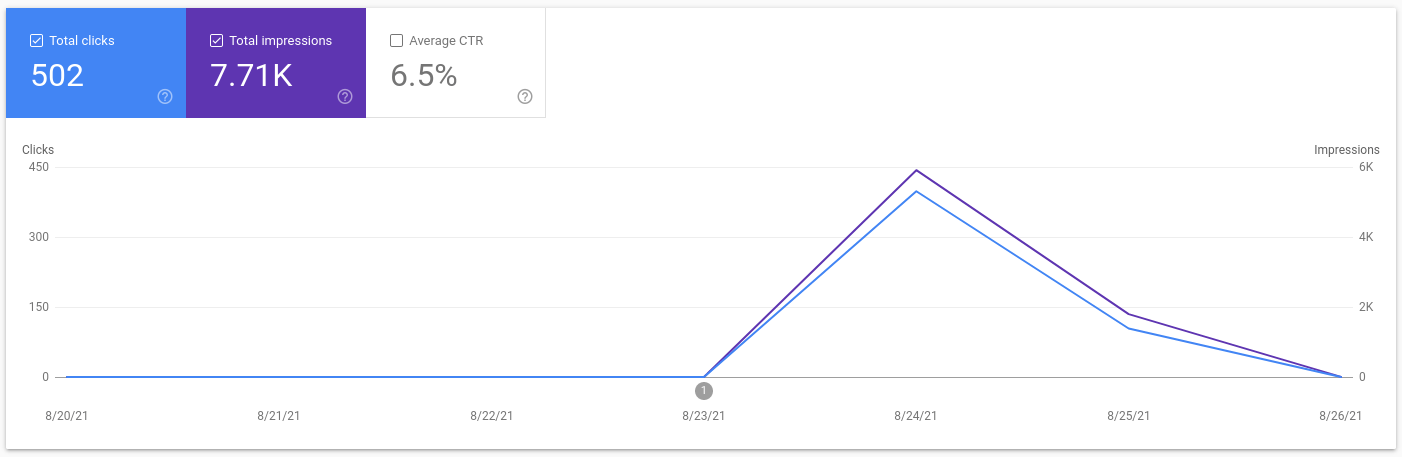
I’m not sure what caused the 2nd spike… But when the link got popular on Reddit; it also started appearing in Google Discover, which brought in even more visitors 🙂
Getting a surge of traffic because of a link posted on a popular website; is called the Slashdot effect, or Reddit hug of death. This has been known to bring sites down, as they are simply not able to handle the amount of traffic.
This isn’t a problem for a static website, especially when hosted through a large CDN like CloudFront.
How much traffic?
So how much traffic exactly? Well… quite a lot actually. Lets look at the numbers:
| Month | Data transfer | Cost |
|---|---|---|
| July | 4.9 GB | $0.80 |
| August | 83.7 GB | $8.22 |
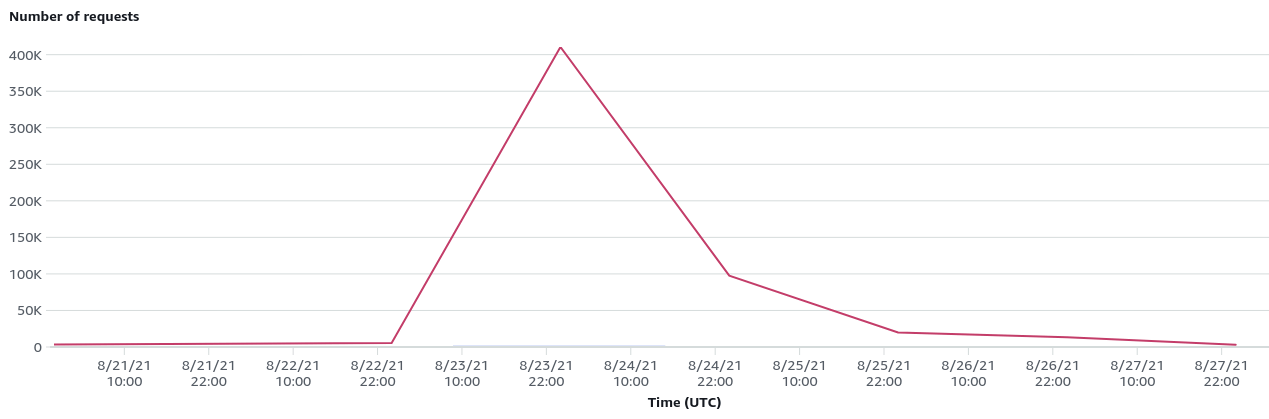
That’s a pretty big increase 🙂 Here are some graphs for August 21 to 27:
Breaking it down into days:
| Date | Data transfer | Requests | Cost |
|---|---|---|---|
| Aug. 23 | 0.2 GB | 5,536 | $0.03 |
| Aug. 24 | 59.35 GB | 410,513 | $5.61 |
| Aug. 25 | 13.49 GB | 97,604 | $1.31 |
| Aug. 26 | 2.09 GB | 19,837 | $0.21 |
| Aug. 27 | 1.07 GB | 13,198 | $0.12 |
The spike on the 24th is quite visible, before slowly flattening out.
I’m expecting that I might get some long lasting effects from the visitor boost, as some Redditors indicated that they liked the blog and subscribed to the RSS feed 👍
Looking at the top five objects, in bytes transferred, we can see that they are all images:
| Object | Requests | Hits % | Total bytes |
|---|---|---|---|
| google maps trench (png) | 7,360 | 99.35% | 1.56 GB |
| 20210724 185152 1200x0 (jpg) | 2,330 | 96.01% | 1.2 GB |
| 20210724 174234 1200x0 (jpg) | 2,352 | 96.09% | 1.05 GB |
| cover 860x0 (webp) | 4,576 | 98.23% | 1.04 GB |
| 20210724 221958 1200x0 (jpg) | 2,309 | 96.23% | 0.93 GB |
Not surprising really — the post is very image heavy. And I include larger images for high pixel density screens.
The reason “google maps trench” PNG tops the list, is because PNGs are not scaled in multiple sizes and using srcset. I found that a properly compressed PNG doesn’t really benefit from it. So all users get the same file, while other images are served based on the user’s viewport width and pixel density.
Scrolled all the way to the end, on desktop, the post is 7.07 MB transferred, 6.75 of which are images. Even more when on a mobile device with a high pixel density screen; 17 MB worth of images 😮
That’s more than I expected, I like including images for high pixel density screens because they look amazingly sharp. But I need to figure out how I can make them smaller…
Webperf
Let’s have a quick look at the techniques I use on this site :
- CSS and JS files are minified, and only loaded on pages which needs them
- When possible; they are deferred to not block rendering
- E.g. Video.js CSS and JS are only loaded on pages with videos
- The entire sits behind CloudFront; cached and geographically close to the users
- Responsive images, using
srcset(except PNGs)- Covers:
620w860w1200w1600w - Figures:
500w800w1200w1600w
- Covers:
- No dynamic creation, it’s a static website 🙂
- Setting client and shared cache policies;
max-ageands-maxage - Lazy loading images (natively using
loading=lazy), except covers (as they are always above the fold)- Using the dominant color as placeholders
- Brotli compression, by CloudFront
- Don’t rely on third-party domains or resources
- All assets are on the website domain
- No YouTube embeds
- Cover images are available as WebP for browser that support it
- I haven’t implemented this for figures — yet
PageSpeed Insights
Lets see what Google’s PageSpeed Insights thinks about the post in question:
Mobile

There is some room for improvement.
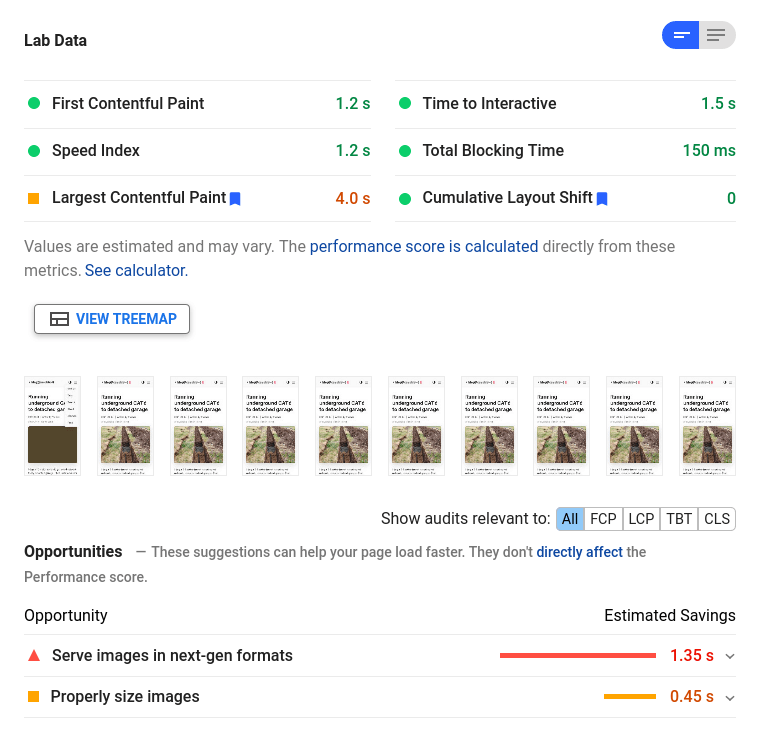
Looks like I need to implement WebP image format for all images, not just covers.
Desktop
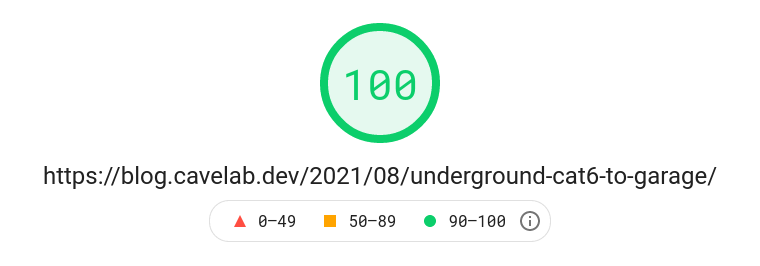
Nice! Doesn’t get any better than that 👍
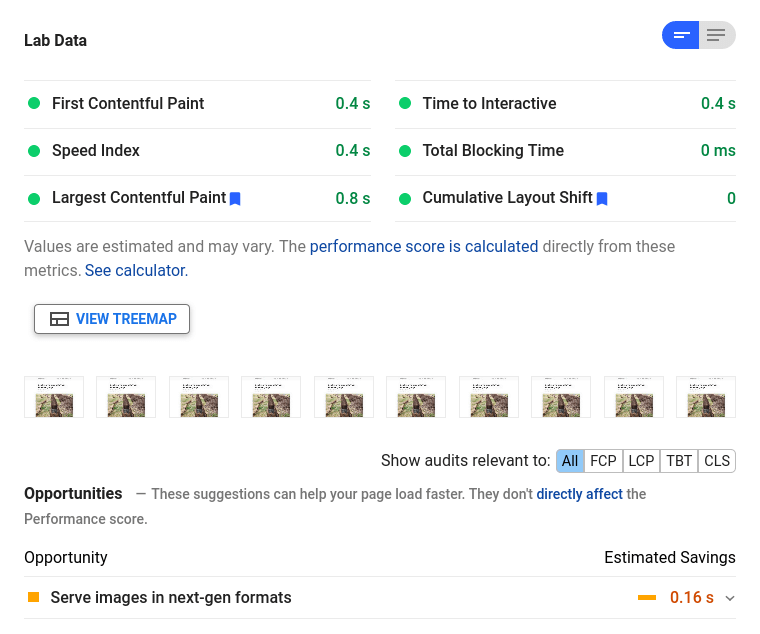
Tiny improvement possible by using WebP on desktop as well, but the impact is much bigger on mobile.
Improvements
I spent the weekend after the traffic spike making further performance improvements:
- Reduced the quality from 60/40 to 40/30 % on images for high pixel density screens
- They look just as good with a lower quality setting
- This posts explains it well: JPEG Compression: Is 80 the magic quality - the retina screens
- Implemented WebP for figures
- Only use WebP if it’s smaller than JPEG
- I noticed that sometimes, especially with very detailed images, the WebP turns out larger than the JPEG
- So I only include the WebP as a picture source if it’s smaller than the JPEG
- Here is an example of an image which is larger as WebP than JPEG
- Replaced some PNG images with JPEG
- Turned out that the “google maps trench” PNG worked better as a JPEG 🙂
Here are the results, before and after the improvements; (images only, scrolled to the bottom):
| Improvements | Desktop | Mobile |
|---|---|---|
| Images, before | 6.75 MB | 17 MB |
| Images, after | 5.87 MB | 11.62 MB |
| PageSpeed, before | 100 | 86 |
| Pagespeed, after | 100 | 87 |
The page weight, especially for mobile, got a huge improvement! I’m a bit surprised that this affected the PageSpeed score so little, but I suspect it’s because of the lazy loading.
There are still a few more things I’m looking into:
- Handle PNGs better
- Do I really need a webfont, or can I switch to a system font?
- Inline critical CSS to prevent render blocking
Ways to reduce cost
S3 and CloudFront has been a cheap way to host this static website — my monthly AWS bill is typically around $3.5.
But when the traffic goes up, so does the bill. CloudFront data transfer out costs $0.085 for United States, Mexico, Canada, Europe and Israel. It’s more expensive for the other regions, but America and Europe is where I get the most traffic.
There are really only two ways to bring the cost down; reduce the cost per GB, or reduce the amount transferred.
At scale; even a 100 KB weight reduction can save gigabytes of transferred data. I wrote about optimizing this website in the chapter above.
So let’s look at cost per GB. Services like Netlify and Vercel will host your site for free, but there are some limits. Both services have 100 GB per month bandwidth limit, if you stay below that; the service is free. But if you go over, it can get expensive. Netlify charges $20 per 100 GB, while it seems that you have to change to the Pro plan with Vercel.
I’m a big fan of pay-as-you-go, instead of keeping within the limits of a plan.
Dedicated image subdomain
One possible solution, should my CloudFront bill get too high, could be to use a dedicated image subdomain.
I’d keep my website, assets, and above the fold images, like covers, on CloudFront. I really like CloudFront — and the performance is awesome 🙂
But all figures could be served from a subdomain like media.cavelab.dev, using a cheaper service — like Bunny.net (starting at $0.01 per GB).
The Hugo deployment configuration supports multiple targets and filtering. The example below uploads only images to s3://my-blog-static/images/:
[[deployment.targets]]
  name = "aws-s3-images"
  URL = "s3://my-blog-static?region=eu-central-1&prefix=images/"
  include = "**.{jpg,jpeg,gif,png,webp}"
Using this as the origin for the image subdomain, and making a small change in the figure shortcode, and the solution would be ready. And maybe use preconnect and dns-prefetch for this domain to minimize any delays 🙂
Closing thoughts
It was very exciting to see one of my posts get that much traffic, and a great learning experience. I got to see first hand that small changes can have big impacts, and got motivated to further optimize the website.
Knowing that the site, being static and behind CloudFront, could handle the load — was a good feeling 🙂
You never know when your site might blow up, so be prepared 🖖
Last commit 2024-11-11, with message: Add lots of tags to posts.
