While doing some WireGuard testing between local peers; I noticed weird performance issues on my virtual MikroTik router. This lead me down a rabbit hole of testing the layer 3 throughput on my virtual CHR.
The bit rate started at close to 10 Gbit/s, but then dropped to 3-4 — only in one direction 🤷 Time to investigate…
Table of contents
Setup
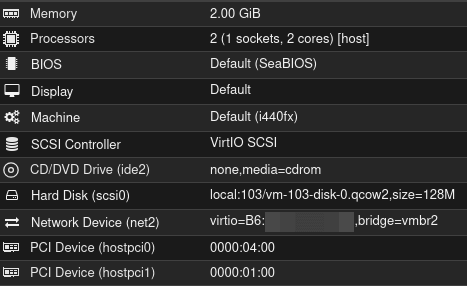
I’m running the MikroTik CHR in Proxmox on my server Kappa, it has an Intel Core i5-6600 CPU @ 3.3GHz and 8 GB RAM. CHR has two cores and 2 GB of RAM.
Two network cards are passed through to CHR: Chelsio T520-CR Dual 10 Gbit and Intel Pro/1000 Dual 1 Gbit. The bridge vmbr2 is not attached to any ports, it’s only used for traffic between the router and DNS server, which is hosted on the same hypervisor.
CPU type was kvm64, but changed to host during this testing. This seems to have improved the WireGuard throughput slightly.
Layer 2 testing
Using iperf3; I started with a quick test of the layer 2 throughput between two LXC containers on the same network segment, but on different hypervisors:
root@iperf2:~# iperf3 -c 192.168.1.23
Connecting to host 192.168.1.23, port 5201
[  5] local 192.168.1.34 port 57804 connected to 192.168.1.23 port 5201
[ ID] Interval           Transfer     Bitrate         Retr  Cwnd
[  5]   0.00-1.00   sec  1.07 GBytes  9.22 Gbits/sec   55   1.13 MBytes
[  5]   1.00-2.00   sec  1.09 GBytes  9.35 Gbits/sec    1   1.51 MBytes
[  5]   2.00-3.00   sec  1.07 GBytes  9.19 Gbits/sec  781   1.21 MBytes
[  5]   3.00-4.00   sec  1.09 GBytes  9.34 Gbits/sec    5   1.51 MBytes
[  5]   4.00-5.00   sec  1.08 GBytes  9.30 Gbits/sec    0   1.55 MBytes
[  5]   5.00-6.00   sec  1.08 GBytes  9.26 Gbits/sec    0   1.58 MBytes
[  5]   6.00-7.00   sec  1.09 GBytes  9.34 Gbits/sec   22   1.49 MBytes
[  5]   7.00-8.00   sec  1.08 GBytes  9.27 Gbits/sec    6   1.53 MBytes
[  5]   8.00-9.00   sec  1.05 GBytes  8.99 Gbits/sec   11   1.39 MBytes
[  5]   9.00-10.00  sec  1.08 GBytes  9.25 Gbits/sec    0   1.51 MBytes
- - - - - - - - - - - - - - - - - - - - - - - - -
[ ID] Interval           Transfer     Bitrate         Retr
[  5]   0.00-10.00  sec  10.8 GBytes  9.25 Gbits/sec  881             sender
[  5]   0.00-10.00  sec  10.8 GBytes  9.25 Gbits/sec                  receiver

Accepted connection from 192.168.1.34, port 54746
[  5] local 192.168.1.23 port 5201 connected to 192.168.1.34 port 54754
[ ID] Interval           Transfer     Bitrate         Retr  Cwnd
[  5]   0.00-1.00   sec  1.07 GBytes  9.18 Gbits/sec  139    704 KBytes
[  5]   1.00-2.00   sec  1.09 GBytes  9.35 Gbits/sec   23    457 KBytes
[  5]   2.00-3.00   sec  1.09 GBytes  9.40 Gbits/sec    5    769 KBytes
[  5]   3.00-4.00   sec  1.09 GBytes  9.41 Gbits/sec   48    419 KBytes
[  5]   4.00-5.00   sec  1.09 GBytes  9.41 Gbits/sec    8    498 KBytes
[  5]   5.00-6.00   sec  1.09 GBytes  9.38 Gbits/sec   10    184 KBytes
[  5]   6.00-7.00   sec  1.07 GBytes  9.20 Gbits/sec   21    609 KBytes
[  5]   7.00-8.00   sec  1.09 GBytes  9.39 Gbits/sec    9    609 KBytes
[  5]   8.00-9.00   sec  1.08 GBytes  9.31 Gbits/sec   71    718 KBytes
[  5]   9.00-10.00  sec  1.09 GBytes  9.41 Gbits/sec    7    653 KBytes
- - - - - - - - - - - - - - - - - - - - - - - - -
[ ID] Interval           Transfer     Bitrate         Retr
[  5]   0.00-10.00  sec  10.9 GBytes  9.34 Gbits/sec  341             sender
Pretty close to 10 Gbit/s in both directions.
Layer 3 testing
Containers
Then I moved one container to a VLAN and tested again, forward and reverse.
Now I was getting very inconsistent results — sometimes almost 10 Gbit/s, other times 3-4, running iperf3 multiple times produced different results:
root@iperf1:~# iperf3 -c 10.121.50.31
Connecting to host 10.121.50.31, port 5201
[  5] local 192.168.1.23 port 46900 connected to 10.121.50.31 port 5201
[ ID] Interval           Transfer     Bitrate         Retr  Cwnd
[  5]   0.00-1.00   sec   444 MBytes  3.73 Gbits/sec  1036    262 KBytes
[  5]   1.00-2.00   sec   491 MBytes  4.12 Gbits/sec  793    175 KBytes
[  5]   2.00-3.00   sec   432 MBytes  3.63 Gbits/sec  872    161 KBytes
[  5]   3.00-4.00   sec   496 MBytes  4.16 Gbits/sec  880   90.5 KBytes
[  5]   4.00-5.00   sec   421 MBytes  3.53 Gbits/sec  695   43.8 KBytes
[  5]   5.00-6.00   sec   474 MBytes  3.97 Gbits/sec  672    212 KBytes
[  5]   6.00-7.00   sec   433 MBytes  3.63 Gbits/sec  538    420 KBytes
[  5]   7.00-8.00   sec   487 MBytes  4.09 Gbits/sec  1019    109 KBytes
[  5]   8.00-9.00   sec   437 MBytes  3.66 Gbits/sec  599    120 KBytes
[  5]   9.00-10.00  sec   474 MBytes  3.98 Gbits/sec  878    245 KBytes
- - - - - - - - - - - - - - - - - - - - - - - - -
[ ID] Interval           Transfer     Bitrate         Retr
[  5]   0.00-10.00  sec  4.48 GBytes  3.85 Gbits/sec  7982             sender
[  5]   0.00-10.00  sec  4.48 GBytes  3.85 Gbits/sec                  receiver

iperf Done.
root@iperf1:~# iperf3 -c 10.121.50.31 --reverse
Connecting to host 10.121.50.31, port 5201
Reverse mode, remote host 10.121.50.31 is sending
[  5] local 192.168.1.23 port 56850 connected to 10.121.50.31 port 5201
[ ID] Interval           Transfer     Bitrate
[  5]   0.00-1.00   sec  1.06 GBytes  9.12 Gbits/sec
[  5]   1.00-2.00   sec  1.07 GBytes  9.22 Gbits/sec
[  5]   2.00-3.00   sec  1.08 GBytes  9.30 Gbits/sec
[  5]   3.00-4.00   sec  1.08 GBytes  9.29 Gbits/sec
[  5]   4.00-5.00   sec   868 MBytes  7.27 Gbits/sec
[  5]   5.00-6.00   sec  1.08 GBytes  9.32 Gbits/sec
[  5]   6.00-7.00   sec  1.09 GBytes  9.37 Gbits/sec
[  5]   7.00-8.00   sec  1.09 GBytes  9.36 Gbits/sec
[  5]   8.00-9.00   sec  1.08 GBytes  9.32 Gbits/sec
[  5]   9.00-10.00  sec  1.09 GBytes  9.33 Gbits/sec
- - - - - - - - - - - - - - - - - - - - - - - - -
[ ID] Interval           Transfer     Bitrate         Retr
[  5]   0.00-10.00  sec  10.6 GBytes  9.09 Gbits/sec  776             sender
[  5]   0.00-10.00  sec  10.6 GBytes  9.09 Gbits/sec                  receiver
When the speed dropped to 3-4 Gbit/s, the retry count was very high 😕
Physical machines
Since the containers has virtual network interfaces, the traffic has to pass through the Linux bridge in Proxmox. And this can also be a bottleneck — so, I tested again between two physical machines on different VLANs.
I ran multiple successful tests, forward and reverse, getting close to 10 Gbit/s. But then this suddenly happened:
sigma ➜  ~ iperf3 -c 10.121.50.46 -t 60
Connecting to host 10.121.50.46, port 5201
[  6] local 192.168.1.222 port 49368 connected to 10.121.50.46 port 5201
[ ID] Interval           Transfer     Bitrate         Retr  Cwnd
[  6]   0.00-1.00   sec   547 MBytes  4.58 Gbits/sec  2388    102 KBytes
[  6]   1.00-2.00   sec   563 MBytes  4.73 Gbits/sec  2788    126 KBytes
[  6]   2.00-3.00   sec   633 MBytes  5.31 Gbits/sec  3530    126 KBytes
[  6]   3.00-4.00   sec   126 MBytes  1.06 Gbits/sec  476   1.41 KBytes
[  6]   4.00-5.00   sec   156 MBytes  1.30 Gbits/sec  1004   72.1 KBytes
[  6]   5.00-6.00   sec   602 MBytes  5.05 Gbits/sec  3636    279 KBytes
[  6]   6.00-7.00   sec   473 MBytes  3.96 Gbits/sec  2993    113 KBytes
[  6]   7.00-8.00   sec   595 MBytes  4.99 Gbits/sec  2968   96.2 KBytes
[  6]   8.00-9.00   sec   511 MBytes  4.29 Gbits/sec  1541    218 KBytes
[  6]   9.00-10.00  sec   556 MBytes  4.66 Gbits/sec  1615    113 KBytes
[  6]  10.00-11.00  sec   442 MBytes  3.71 Gbits/sec  3346    269 KBytes
[  6]  11.00-12.00  sec   582 MBytes  4.89 Gbits/sec  2927   97.6 KBytes
[  6]  12.00-13.00  sec   592 MBytes  4.97 Gbits/sec  1968    133 KBytes
[  6]  13.00-14.00  sec   557 MBytes  4.67 Gbits/sec  2113    235 KBytes
[  6]  14.00-15.00  sec   581 MBytes  4.87 Gbits/sec  1314    120 KBytes
[  6]  15.00-16.00  sec   563 MBytes  4.72 Gbits/sec  1961    116 KBytes
[  6]  16.00-17.00  sec   473 MBytes  3.97 Gbits/sec  1604    127 KBytes
[  6]  17.00-18.00  sec   570 MBytes  4.78 Gbits/sec  3480    154 KBytes
[  6]  18.00-19.00  sec   540 MBytes  4.53 Gbits/sec  2284   97.6 KBytes
[  6]  19.00-20.00  sec   582 MBytes  4.88 Gbits/sec  1588    133 KBytes
[  6]  20.00-21.00  sec   512 MBytes  4.30 Gbits/sec  1996   97.6 KBytes
[  6]  21.00-22.00  sec   558 MBytes  4.68 Gbits/sec  1503    113 KBytes
[  6]  22.00-23.00  sec   445 MBytes  3.74 Gbits/sec  2475   90.5 KBytes
[  6]  23.00-24.00  sec   300 MBytes  2.51 Gbits/sec  1085   1.41 KBytes
[  6]  24.00-25.00  sec  0.00 Bytes  0.00 bits/sec    2   1.41 KBytes
[  6]  25.00-26.00  sec  0.00 Bytes  0.00 bits/sec    0   1.41 KBytes
[  6]  26.00-27.00  sec  0.00 Bytes  0.00 bits/sec    1   1.41 KBytes
[  6]  27.00-28.00  sec  0.00 Bytes  0.00 bits/sec    0   1.41 KBytes
[  6]  28.00-29.00  sec  0.00 Bytes  0.00 bits/sec    0   1.41 KBytes
[  6]  29.00-30.00  sec  0.00 Bytes  0.00 bits/sec    1   1.41 KBytes
[  6]  30.00-31.00  sec  0.00 Bytes  0.00 bits/sec    0   1.41 KBytes
[  6]  31.00-32.00  sec  0.00 Bytes  0.00 bits/sec    0   1.41 KBytes
[  6]  32.00-33.00  sec  0.00 Bytes  0.00 bits/sec    0   1.41 KBytes
[  6]  33.00-34.00  sec  0.00 Bytes  0.00 bits/sec    0   1.41 KBytes
[  6]  34.00-35.00  sec  0.00 Bytes  0.00 bits/sec    0   1.41 KBytes
[  6]  35.00-36.00  sec  0.00 Bytes  0.00 bits/sec    0   1.41 KBytes
[  6]  36.00-37.00  sec  0.00 Bytes  0.00 bits/sec    1   1.41 KBytes
[  6]  37.00-38.00  sec  0.00 Bytes  0.00 bits/sec    0   1.41 KBytes
[  6]  38.00-39.00  sec  0.00 Bytes  0.00 bits/sec    0   1.41 KBytes
[  6]  39.00-40.00  sec  0.00 Bytes  0.00 bits/sec    0   1.41 KBytes
[  6]  40.00-41.00  sec  0.00 Bytes  0.00 bits/sec    0   1.41 KBytes
[  6]  41.00-42.00  sec  0.00 Bytes  0.00 bits/sec    0   1.41 KBytes
[  6]  42.00-43.00  sec  0.00 Bytes  0.00 bits/sec    0   1.41 KBytes
[  6]  43.00-44.00  sec  0.00 Bytes  0.00 bits/sec    0   1.41 KBytes
[  6]  44.00-45.00  sec  0.00 Bytes  0.00 bits/sec    0   1.41 KBytes
[  6]  45.00-46.00  sec  0.00 Bytes  0.00 bits/sec    0   1.41 KBytes
[  6]  46.00-47.00  sec  0.00 Bytes  0.00 bits/sec    0   1.41 KBytes
[  6]  47.00-48.00  sec  0.00 Bytes  0.00 bits/sec    0   1.41 KBytes
[  6]  48.00-49.00  sec  0.00 Bytes  0.00 bits/sec    0   1.41 KBytes
[  6]  49.00-50.00  sec   241 MBytes  2.02 Gbits/sec   52   1.31 MBytes
[  6]  50.00-51.00  sec  1.09 GBytes  9.35 Gbits/sec   22   1.22 MBytes
[  6]  51.00-52.00  sec  1.09 GBytes  9.35 Gbits/sec  808    969 KBytes
[  6]  52.00-53.00  sec  1.09 GBytes  9.34 Gbits/sec    1   1.19 MBytes
[  6]  53.00-54.00  sec  1.09 GBytes  9.35 Gbits/sec    1   1.47 MBytes
[  6]  54.00-55.00  sec  1.09 GBytes  9.34 Gbits/sec  611    945 KBytes
[  6]  55.00-56.00  sec  1.09 GBytes  9.34 Gbits/sec    2   1.06 MBytes
[  6]  56.00-57.00  sec  1.09 GBytes  9.33 Gbits/sec   75   1.05 MBytes
[  6]  57.00-58.00  sec  1.09 GBytes  9.36 Gbits/sec    1   1.22 MBytes
[  6]  58.00-59.00  sec  1.07 GBytes  9.21 Gbits/sec   34    870 KBytes
[  6]  59.00-60.00  sec   900 MBytes  7.55 Gbits/sec  450   1.29 MBytes
- - - - - - - - - - - - - - - - - - - - - - - - -
[ ID] Interval           Transfer     Bitrate         Retr
[  6]   0.00-60.00  sec  55.3 GBytes  5.28 Gbits/sec  58111             sender
[  6]   0.00-60.00  sec  55.3 GBytes  5.28 Gbits/sec                  receiver
It started slow… But then dropped to 0, before picking up and continuing at close to 10 Gbit/s. What the hell happened here? 😕
Looks like the router just dropped the ball — checking the MikroTik CHR log confirmed that suspicion:
router was rebooted without proper shutdown
The router rebooted 😮 This was a clear indicator that the CHR itself was the problem, not the virtualisation layer in Proxmox.
The router
I first ran a bandwidth test locally on the CHR to 127.0.0.1, just to verify its routing capabilities. I’m limited to 10 Gbit/s because of my P10 license, but I didn’t see any slowdowns.
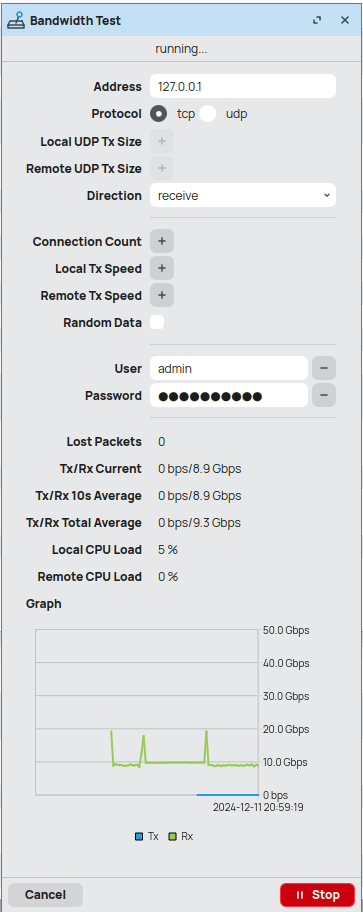
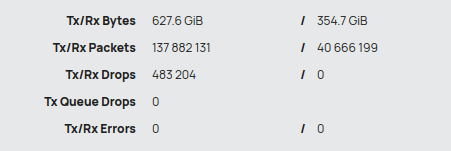
Looking at the traffic statistics for the interface in CHR, I noticed TX queue drops going up when having low throughput.
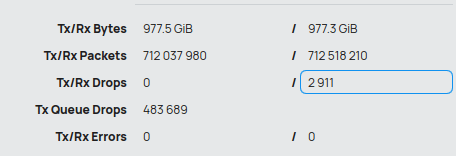
ether3On my VLAN 50, used for this test, the Tx/Rx Drops were going up significantly.
Now armed with some new keywords to research I stumbled onto this post on the MikroTik forum:
Hello, I was having more than 1000 TX Drops/sec only in a VLAN, there wasn’t any drops in his ethernet interface. I was having a lot of troubles with DOS in web pages, youtube, etc.
Looking for the solution in the forum I realized the following changes:
1.- Interface queue type from “only-hardware-queue” to “ethernet-default”.
2.- Ethernet-default queue size from 50 to 200, kind pfifo.
When I changed the interface queue type from only-hardware-queue to ethernet-default the Tx drops on the VLAN interface stopped and the throughout immediately went up to almost 10 Gbit/s.
I tried changing from only-hardware-queue to multi-queue-ethernet-default while doing an iperf3 test — the throughput went up to close to 10 Gbit/s and the retries went down:
sigma ➜  ~ iperf3 -c 10.121.50.46 -t 90
Connecting to host 10.121.50.46, port 5201
[  6] local 192.168.1.222 port 49346 connected to 10.121.50.46 port 5201
[ ID] Interval           Transfer     Bitrate         Retr  Cwnd
[  6]   0.00-1.00   sec   490 MBytes  4.11 Gbits/sec  2064   76.4 KBytes
[  6]   1.00-2.00   sec   501 MBytes  4.20 Gbits/sec  2996    116 KBytes
[  6]   2.00-3.00   sec   419 MBytes  3.51 Gbits/sec  1421    315 KBytes
[  6]   3.00-4.00   sec   507 MBytes  4.25 Gbits/sec  2395   55.1 KBytes
[  6]   4.00-5.00   sec   528 MBytes  4.43 Gbits/sec  2781    198 KBytes
[  6]   5.00-6.00   sec   421 MBytes  3.53 Gbits/sec  2057    134 KBytes
[  6]   6.00-7.00   sec   524 MBytes  4.40 Gbits/sec  3308    105 KBytes
[  6]   7.00-8.00   sec   502 MBytes  4.21 Gbits/sec  2784    146 KBytes
[  6]   8.00-9.00   sec   405 MBytes  3.39 Gbits/sec  1616   84.8 KBytes
[  6]   9.00-10.00  sec   536 MBytes  4.49 Gbits/sec  2151   87.7 KBytes
[  6]  10.00-11.00  sec   900 MBytes  7.55 Gbits/sec  561   1.38 MBytes
[  6]  11.00-12.00  sec  1.09 GBytes  9.33 Gbits/sec  173   1.78 MBytes
[  6]  12.00-13.00  sec  1.08 GBytes  9.31 Gbits/sec   67   1.55 MBytes
[  6]  13.00-14.00  sec  1.09 GBytes  9.33 Gbits/sec   33   1.14 MBytes
[  6]  14.00-15.00  sec  1.09 GBytes  9.34 Gbits/sec    0   1.72 MBytes
[  6]  15.00-16.00  sec  1.09 GBytes  9.32 Gbits/sec    2   1.10 MBytes
[  6]  16.00-17.00  sec  1.08 GBytes  9.30 Gbits/sec  312    952 KBytes
[  6]  17.00-18.00  sec  1.08 GBytes  9.30 Gbits/sec    8    949 KBytes
[  6]  18.00-19.00  sec  1.09 GBytes  9.33 Gbits/sec   52   1.14 MBytes
[  6]  19.00-20.00  sec  1.08 GBytes  9.32 Gbits/sec    2   1.15 MBytes
[  6]  20.00-21.00  sec  1.09 GBytes  9.33 Gbits/sec    2   1.17 MBytes
[  6]  21.00-22.00  sec  1.09 GBytes  9.33 Gbits/sec    0   1.72 MBytes
[  6]  22.00-23.00  sec  1.08 GBytes  9.29 Gbits/sec  463    945 KBytes
[  6]  23.00-24.00  sec  1.08 GBytes  9.31 Gbits/sec    3   1.18 MBytes
[  6]  24.00-25.00  sec  1.08 GBytes  9.31 Gbits/sec  317    933 KBytes
[  6]  25.00-26.00  sec  1.09 GBytes  9.34 Gbits/sec    2   1.04 MBytes
[  6]  26.00-27.00  sec  1.08 GBytes  9.32 Gbits/sec  142    922 KBytes
[  6]  27.00-28.00  sec  1.08 GBytes  9.31 Gbits/sec   28   1003 KBytes
[  6]  28.00-29.00  sec  1.09 GBytes  9.33 Gbits/sec    4    930 KBytes
[  6]  29.00-30.00  sec  1.08 GBytes  9.30 Gbits/sec  282    799 KBytes
MikroTik documentation says the following about interface queues:
All MikroTik products have the default queue type “only-hardware-queue” with “kind=none”. “only-hardware-queue” leaves the interface with only hardware transmit descriptor ring buffer which acts as a queue in itself. Usually, at least 100 packets can be queued for transmit in the transmit descriptor ring buffer. Transmit descriptor ring buffer size and the number of packets that can be queued in it varies for different types of ethernet MACs. Having no software queue is especially beneficial on SMP systems because it removes the requirement to synchronize access to it from different CPUs/cores which is resource-intensive. Having the possibility to set “only-hardware-queue” requires support in an ethernet driver so it is available only for some ethernet interfaces mostly found on RouterBOARDs.
A “multi-queue-ethernet-default” can be beneficial on SMP systems with ethernet interfaces that have support for multiple transmit queues and have a Linux driver support for multiple transmit queues. By having one software queue for each hardware queue there might be less time spent on synchronizing access to them.
— https://help.mikrotik.com/docs/spaces/ROS/pages/328088/Queues
Based on this I started using the multi-queue-ethernet-default queue on my ether3 interface:

ether3. It can not be set on the VLAN interface.
I think the reason why it sometimes required multiple test runs before the throughput dropped, is because the queue hadn’t filled up. But once it did — things started going bad.
WireGuard
Getting back to my WireGuard testing; initially I was getting 800-900 Mbit/s in one direction and 2.3-2.5 Gbit/s in the other, and that is just strange…
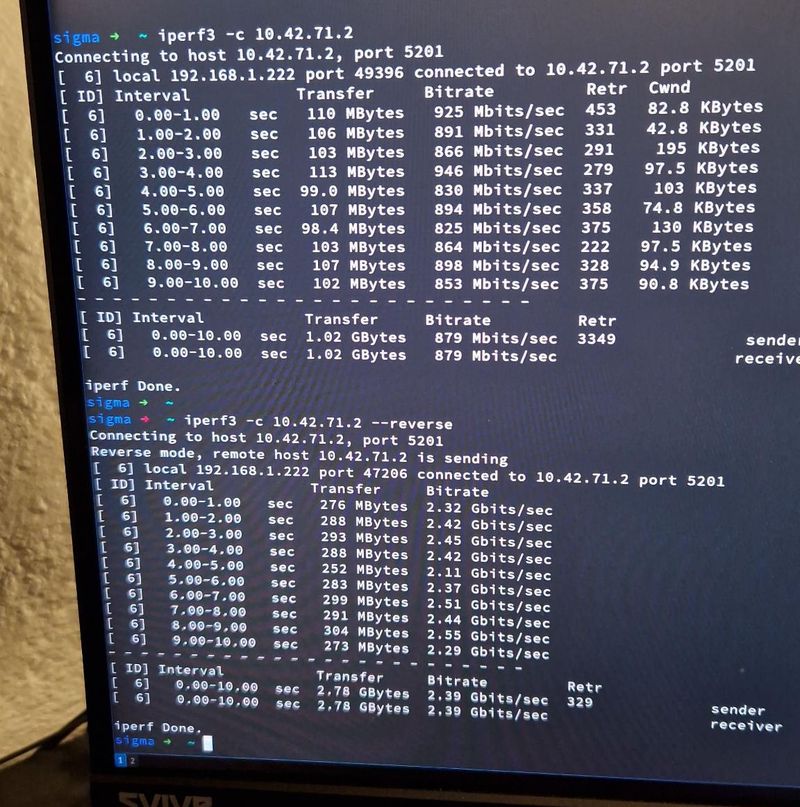
Retesting WireGuard after changing the interface queue confirmed it was faster — in both directions:
sigma ➜  ~ iperf3 -c 10.42.71.2 -t 20
Connecting to host 10.42.71.2, port 5201
[  6] local 192.168.1.222 port 41472 connected to 10.42.71.2 port 5201
[ ID] Interval           Transfer     Bitrate         Retr  Cwnd
[  6]   0.00-1.00   sec   383 MBytes  3.21 Gbits/sec   89   1.34 MBytes
[  6]   1.00-2.00   sec   391 MBytes  3.28 Gbits/sec   16   1.17 MBytes
[  6]   2.00-3.00   sec   392 MBytes  3.29 Gbits/sec   10   1006 KBytes
[  6]   3.00-4.00   sec   393 MBytes  3.30 Gbits/sec    0   1.23 MBytes
[  6]   4.00-5.00   sec   385 MBytes  3.23 Gbits/sec   33   1.02 MBytes
[  6]   5.00-6.00   sec   359 MBytes  3.01 Gbits/sec    0   1.24 MBytes
[  6]   6.00-7.00   sec   393 MBytes  3.30 Gbits/sec   22   1.04 MBytes
[  6]   7.00-8.00   sec   389 MBytes  3.26 Gbits/sec    0   1.27 MBytes
[  6]   8.00-9.00   sec   394 MBytes  3.31 Gbits/sec    8   1.08 MBytes
[  6]   9.00-10.00  sec   384 MBytes  3.22 Gbits/sec    0   1.31 MBytes
[  6]  10.00-11.00  sec   390 MBytes  3.27 Gbits/sec   33   1.14 MBytes
[  6]  11.00-12.00  sec   390 MBytes  3.27 Gbits/sec    0   1.36 MBytes
[  6]  12.00-13.00  sec   392 MBytes  3.29 Gbits/sec    2   1.17 MBytes
[  6]  13.00-14.00  sec   384 MBytes  3.22 Gbits/sec    0   1.38 MBytes
[  6]  14.00-15.00  sec   355 MBytes  2.98 Gbits/sec    3   1.17 MBytes
[  6]  15.00-16.00  sec   393 MBytes  3.30 Gbits/sec   14    990 KBytes
[  6]  16.00-17.00  sec   390 MBytes  3.27 Gbits/sec    0   1.22 MBytes
[  6]  17.00-18.00  sec   386 MBytes  3.24 Gbits/sec   12   1.02 MBytes
[  6]  18.00-19.00  sec   394 MBytes  3.31 Gbits/sec    0   1.26 MBytes
[  6]  19.00-20.00  sec   384 MBytes  3.22 Gbits/sec   16   1.06 MBytes
- - - - - - - - - - - - - - - - - - - - - - - - -
[ ID] Interval           Transfer     Bitrate         Retr
[  6]   0.00-20.00  sec  7.54 GBytes  3.24 Gbits/sec  258             sender
[  6]   0.00-20.00  sec  7.54 GBytes  3.24 Gbits/sec                  receiver


sigma ➜  ~ iperf3 -c 10.42.71.2 -t 20 -R
Connecting to host 10.42.71.2, port 5201
Reverse mode, remote host 10.42.71.2 is sending
[  6] local 192.168.1.222 port 44446 connected to 10.42.71.2 port 5201
[ ID] Interval           Transfer     Bitrate
[  6]   0.00-1.00   sec   374 MBytes  3.13 Gbits/sec
[  6]   1.00-2.00   sec   382 MBytes  3.20 Gbits/sec
[  6]   2.00-3.00   sec   385 MBytes  3.23 Gbits/sec
[  6]   3.00-4.00   sec   390 MBytes  3.28 Gbits/sec
[  6]   4.00-5.00   sec   379 MBytes  3.18 Gbits/sec
[  6]   5.00-6.00   sec   408 MBytes  3.42 Gbits/sec
[  6]   6.00-7.00   sec   399 MBytes  3.35 Gbits/sec
[  6]   7.00-8.00   sec   397 MBytes  3.33 Gbits/sec
[  6]   8.00-9.00   sec   403 MBytes  3.38 Gbits/sec
[  6]   9.00-10.00  sec   395 MBytes  3.31 Gbits/sec
[  6]  10.00-11.00  sec   387 MBytes  3.25 Gbits/sec
[  6]  11.00-12.00  sec   392 MBytes  3.29 Gbits/sec
[  6]  12.00-13.00  sec   400 MBytes  3.35 Gbits/sec
[  6]  13.00-14.00  sec   399 MBytes  3.35 Gbits/sec
[  6]  14.00-15.00  sec   375 MBytes  3.15 Gbits/sec
[  6]  15.00-16.00  sec   379 MBytes  3.18 Gbits/sec
[  6]  16.00-17.00  sec   387 MBytes  3.24 Gbits/sec
[  6]  17.00-18.00  sec   402 MBytes  3.37 Gbits/sec
[  6]  18.00-19.00  sec   400 MBytes  3.36 Gbits/sec
[  6]  19.00-20.00  sec   393 MBytes  3.30 Gbits/sec
- - - - - - - - - - - - - - - - - - - - - - - - -
[ ID] Interval           Transfer     Bitrate         Retr
[  6]   0.00-20.00  sec  7.65 GBytes  3.28 Gbits/sec   19             sender
[  6]   0.00-20.00  sec  7.64 GBytes  3.28 Gbits/sec                  receiver
Looking at htop during this test; I found that one core on the hypervisor with CHR was peaking at 100%. That seemed to be the limiting factor.
I then tried setting the interface queue back to only-hardware-queue, and change it to multi-queue-ethernet-default while doing an iperf3 test. And confirmed the results from earlier:
sigma ➜  ~ iperf3 -c 10.42.71.2 -t 90
Connecting to host 10.42.71.2, port 5201
[  6] local 192.168.1.222 port 60328 connected to 10.42.71.2 port 5201
[ ID] Interval           Transfer     Bitrate         Retr  Cwnd
[  6]   0.00-1.00   sec   130 MBytes  1.09 Gbits/sec  397    127 KBytes
[  6]   1.00-2.00   sec   119 MBytes   997 Mbits/sec  388   80.2 KBytes
[  6]   2.00-3.00   sec   130 MBytes  1.09 Gbits/sec  414    168 KBytes
[  6]   3.00-4.00   sec   123 MBytes  1.03 Gbits/sec  554   58.8 KBytes
[  6]   4.00-5.00   sec   119 MBytes  1.00 Gbits/sec  473   92.2 KBytes
[  6]   5.00-6.00   sec   126 MBytes  1.06 Gbits/sec  465    232 KBytes
[  6]   6.00-7.00   sec   135 MBytes  1.13 Gbits/sec  475    134 KBytes
[  6]   7.00-8.00   sec   132 MBytes  1.11 Gbits/sec  386   94.9 KBytes
[  6]   8.00-9.00   sec   288 MBytes  2.42 Gbits/sec   70    629 KBytes
[  6]   9.00-10.00  sec   400 MBytes  3.35 Gbits/sec    0    986 KBytes
[  6]  10.00-11.00  sec   390 MBytes  3.27 Gbits/sec   71    704 KBytes
[  6]  11.00-12.00  sec   402 MBytes  3.37 Gbits/sec    0   1.00 MBytes
[  6]  12.00-13.00  sec   393 MBytes  3.30 Gbits/sec    0   1.25 MBytes
[  6]  13.00-14.00  sec   390 MBytes  3.28 Gbits/sec    1   1.05 MBytes
[  6]  14.00-15.00  sec   398 MBytes  3.34 Gbits/sec   44   1013 KBytes
The interface queue also affected my WireGuard when testing between local peers.
Conclusion
So in my WireGuard throughput testing — I uncovered, and fixed, an interface queue issue on my virtual CHR. Sweet 👍
I can’t wait to start digging into 25 Gbit/s routing 😎
🖖

