Having a central place to view or search through server logs is awesome. I’ve used Graylog in the past, but I’ve always felt it was a bit cumbersome to set up and use — and it felt overkill for my need.
Instead I gave Grafana Loki and Promtail a try 👇
Table of contents
Loki server
First I installed the Loki server on an LXC container — I downloaded it from the Github release page, unpacked it, and made it executable:
$ wget https://github.com/grafana/loki/releases/download/v2.6.1/loki-linux-amd64.zip
$ unzip loki-linux-amd64.zip
$ chmod a+x loki-linux-amd64
Then I fetched the local-config.yaml file:
$ wget https://raw.githubusercontent.com/grafana/loki/master/cmd/loki/loki-local-config.yaml
I moved the executable and configuration file:
$ sudo mkdir /opt/sbin
$ sudo mv loki-linux-amd64 /opt/sbin/

$ sudo mv loki-local-config.yaml /etc/loki.yaml
Lastly — I made a loki.service file, moved it to /lib/systemd/system/, enabled and started the service:
[Unit]
Description=Grafana Loki

[Service]
Type=simple
ExecStart=/opt/sbin/loki-linux-amd64 --config.file=/etc/loki.yaml
StandardOutput=null
Restart=on-failure

[Install]
WantedBy=multi-user.target
Alias=node-exporter.service
$ sudo mv loki.service /lib/systemd/system/
$ sudo systemctl start loki.service
$ sudo systemctl enable loki.service
Promtail
Now we need to get logs into Loki, and for that we use Promtail and Ansible.
loki.lan.uctrl.net — you obviously need to change this to match your setup.
Ansible
Ansible folder structure:
.
├── promtail.yml
└── roles
    └── promtail
        ├── files
        │   ├── opt
        │   │   └── sbin
        │   │       └── promtail-linux-amd64
        │   └── service
        │       └── promtail.service
        ├── tasks
        │   └── main.yml
        └── templates
            └── promtail.yaml
promtail.yml
---
- hosts: servers
  become: true
  vars:
    ansible_python_interpreter: /usr/bin/python3
  roles:
  - promtail
roles/promtail/files/service/promtail.service
[Unit]
Description=Grafana Promtail

[Service]
Type=simple
ExecStart=/opt/sbin/promtail-linux-amd64 --config.file=/etc/promtail.yaml
StandardOutput=null
Restart=on-failure

[Install]
WantedBy=multi-user.target
Alias=promtail.service
roles/promtail/tasks/main.yml
---
- name: upload scripts (amd64)
  copy:
    src: "{{ item }}"
    dest: /opt/sbin/
    owner: root
    group: root
    mode: 0750
  with_fileglob:
    - opt/sbin/*

- name: copy config
  template:
    src: "promtail.yaml"
    dest: "/etc/promtail.yaml"

- name: upload promtail.service unit file
  copy:
    src: service/promtail.service
    dest: /lib/systemd/system/promtail.service
    owner: root
    group: root
    mode: 0644

- name: restart promtail
  systemd:
    state: restarted
    daemon_reload: yes
    name: promtail

- name: enable promtail.service
  systemd:
    name: promtail.service
    enabled: yes
    masked: no

- name: make sure promtail.service is running
  systemd:
    name: promtail.service
    state: started
roles/promtail/templates/promtail.yaml
server:
  http_listen_port: 9080
  grpc_listen_port: 0

positions:
  filename: /tmp/positions.yaml

clients:
  - url: http://loki.lan.uctrl.net:3100/loki/api/v1/push

scrape_configs:
- job_name: system
  static_configs:
  - targets:
      - localhost
    labels:
      job: varlogs
      hostname: {{ inventory_hostname }}
      __path__: /var/log/*log
Now we just have to run the playbook — and our hosts should start sending their logs to the Loki server 🙂
$ ansible-playbook promtail.yml -K
Grafana
We should now to able to start viewing logs in Grafana.
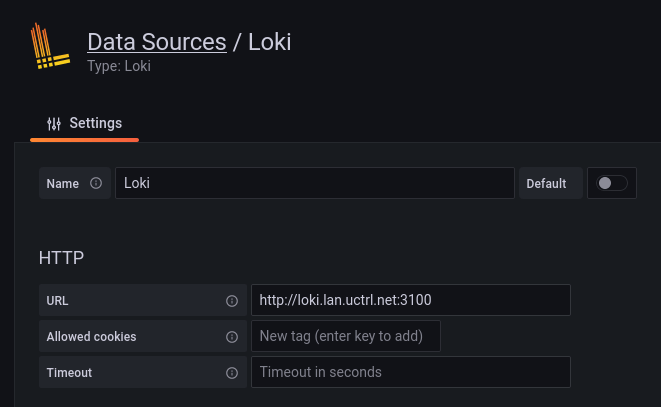
First we need to add it as a data source:

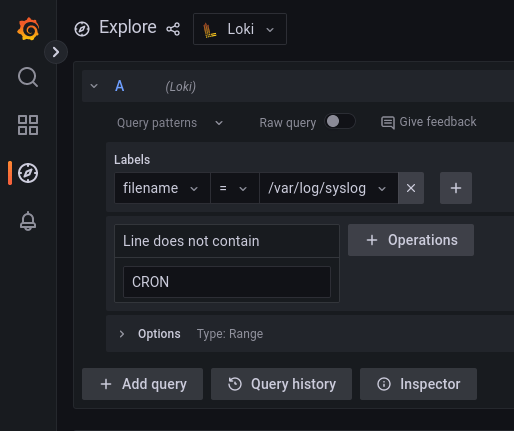
Then we can navigate to Explore, select our Loki data source, and choose a filename label:

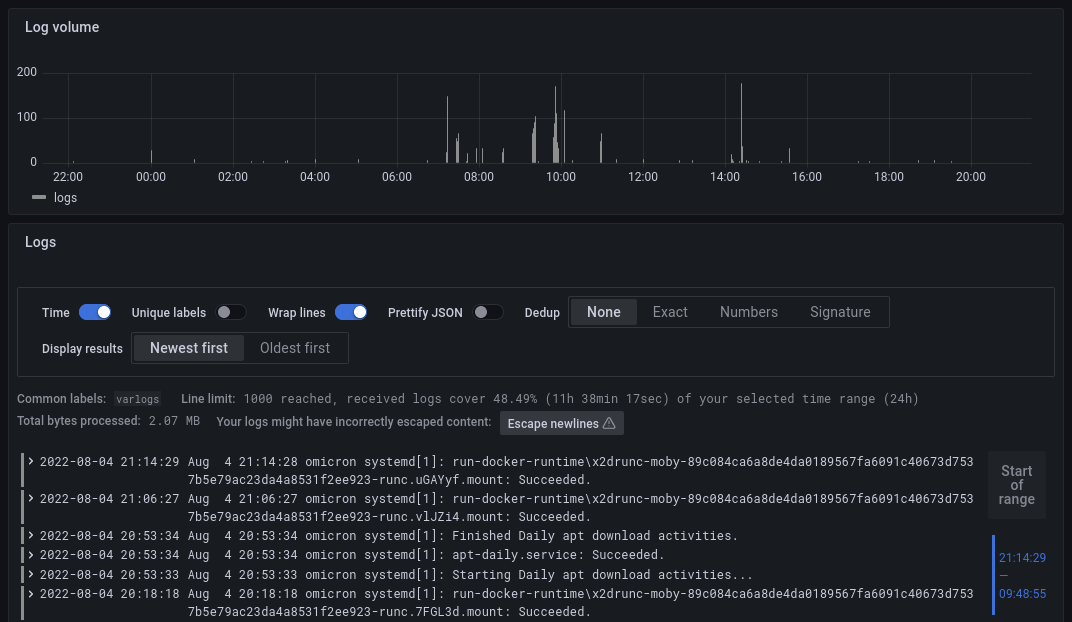
And voila! Glorious logs:

Wrapping up
Getting Loki and Promtail up and running was a breeze 🙂 I already use Grafana for lots of things, so getting logs in there as well was very practical 👍
I’m sure there are more fun things to do with the logs in Grafana — like making dashboard and setting up alarms, but I haven’t explored that yet.
Resources
Last commit 2024-11-27, with message: Add some missing figure captions.

